An Intro to Web Scraping with Python
Published on Nov 26, 2014 by Zaynaib Giwa
Update: There is now a video edition of this blog post thanks to the kind folks over at Webucator Check it out!
Web scraping is the task of extracting data from a website. It’s a nifty skill in any technologist’s toolkit because interesting data isn’t always accessible via an API or in a table/csv - sometimes, interesting data is just sitting on a webpage.
Just about any information that can be viewed in a browser can be scraped and stored for further data analysis. Web pages are scrape-able because the content on any web page is structured with HTML. For anyone who isn’t familiar with HTML, see http://www.w3schools.com/html/html_intro.asp
This is a tutorial for anyone who’s new to web scraping, using:
- python
- beautifulsoup - a python library for pulling data out of HTML/XML
- requests - a python library for sending HTTP requests (i.e. grabbing stuff from the web)
- pandas - a python library for data analysis & manipulation (essentially R in python)
This tutorial assumes some working knowledge of HTML, installing python libraries, and basic coding concepts.
So, say I wanted to create a visualization of dog breed trends in America, from the American Kennel Club dog statistics page. The AKC doesn’t have a way to export their data to CSV, and it would be way too tedious to copy the data manually. To get the data, we’ll need to scrape the web page.
The first step is to inspect the webpage using developer tools from the browser. Firefox web developer extension is my favorite tool to do this. If you’re using Chrome, right click on any webpage and select ‘Inspect Element’ to view the page’s HTML.
As shown in the picture below, there are two tables on the AKC dog registration statistics page. We’re interested in the second one - the one with statistics.
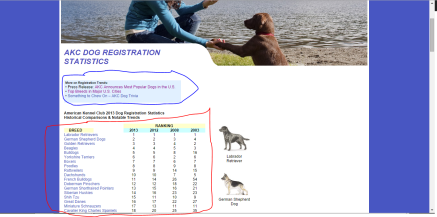
Tables in html are have four tags. Tables are defined with the <table> tag. Tables are divided into table rows with the <tr> tag. Table rows are divided into table data with the <td> tag. A table row can also be divided into table headings with the <th> tag.
Once we know the HTML structure of the data that we care about, we can use beautifulsoup to grab the relevant data from the HTML.
Before writing any code, we have to install and import the necessary libraries in Python. To import the libraries:
from bs4 import BeautifulSoupimport requests
import pandas as pd
After importing the libraries, we need to grab the HTML from the AKC webpage and create a beautifulSoup object.
r = requests.get(url)data = r.textsoup = BeautifulSoup(data)Next, we want to grab the second table from the webpage. Since we want information from the second table only, we need to specify the table we want by using index [1]. If we just use table = soup.find_all(‘table’), it will give us both tables, and if we use soup.find_all(‘table’)[0], it will give us the first table.
table = soup.find_all('table')[1] Next we find all the tr elements, which are all the rows of table 2. We want to skip the first two rows because they contain headers, so we use [2:] to capture only the rows with data.
rows = table.find_all('tr')[2:]
Then, we initialize a dictionary for storing the table data
data = {
'breeds' : [],
'rank2013' : [],
'rank2012' : [],
'rank2008' : [],
'rank2003' : []
}
Next, we loop through all the rows that are in the dog statistics table, and store the data in each column.
for row in rows:
cols = row.find_all('td')
data['breeds'].append( cols[0].get_text() )
data['rank2013'].append( cols[1].get_text() )
data['rank2012'].append( cols[2].get_text() )
data['rank2008'].append( cols[3].get_text() )
data['rank2003'].append( cols[4].get_text() )
Finally, we can create a pandas dataframe from the dictionary we stored data in. A dataframe is a tabular data structure that represents rows and columns, and allows you to easily manipulate and analyze data later on.
dogData = pd.DataFrame( data )
We can also export the dataframe to a CSV.
dogData.to_csv("AKC_Dog_Registrations.csv")
So, the complete code is
from bs4 import BeautifulSoup
import requests
import pandas as pdurl = "https://www.akc.org/reg/dogreg_stats.cfm"r = requests.get(url)data = r.textsoup = BeautifulSoup(data)
table = soup.find_all('table')[1]rows = table.find_all('tr')[2:]
data = {
    'breeds' : [],
    'rank2013' : [],
    'rank2012' : [],
    'rank2008' : [],
    'rank2003' : []
}
for row in rows:
    cols = row.find_all('td')
    data['breeds'].append( cols[0].get_text() )
    data['rank2013'].append( cols[1].get_text() )
    data['rank2012'].append( cols[2].get_text() )
    data['rank2008'].append( cols[3].get_text() )
    data['rank2003'].append( cols[4].get_text() )
dogData = pd.DataFrame( data )
dogData.to_csv("AKC_Dog_Registrations.csv")
There you have it - a data set of dog registration stats. Now, time to make a visualization of dog breed data!
Additional Links
About the author

Zaynaib Giwa
My name is Zaynaib Giwa. I am a Masters student at the University of Illinois. When I am not working on data projects, I read comic books in my spare time.