How Data Can Advance Economic Justice
Published on Jan 27, 2015 by Katie Buitrago
Data Driving the Movement
At Woodstock Institute, our mission is to advance economic justice, particularly for low-wealth communities and communities of color.
To move towards this goal, we prepare data concerning economic justice and empower others to use and understand it. As our national partners at the National Community Reinvestment Coalition say, data drive the movement.
For example, one of the richest datasets we have is the Home Mortgage Disclosure Act (HMDA) dataset, which has information on nearly every mortgage application in Illinois. This data empowered us to detect and demonstrate disparities in mortgage lending, which perpetuates the racial wealth gap. In one study, we found that mortgage lenders were more than twice as likely to deny refinance applications for homeowners in communities of color as for homeowners in white communities.
Analyzing economic data can
- help identify emerging problems or discriminatory practices
- target resources to areas of high need
- make the case to supporters about the necessity of their programs, and
- track the impact of policies that aim to help communities.
That’s why it’s so important to us to make our data accessible to users with a broad range of data literacy, from researchers looking to do advanced analyses to service providers who need a quick sense of where to target their programs.
An Overview of Our Resources
Through a range of data tools, Woodstock Institute is making it even easier for community groups, journalists, developers, governments, and more to access important data on the economic well-being of communities in Illinois.
- Interactive data portal - trends at a glance
This is the quickest way to get an overview of economic trends about your community. The data portal, powered by Tableau, was launched in June 2013.
Users can see trends in foreclosure filings over time, find out who makes the most mortgage loans in their neighborhood, discover how employment rates vary for men and women, and more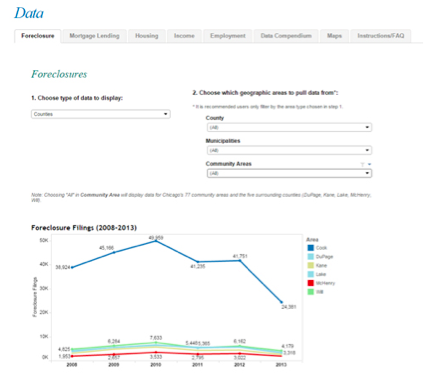
- Interactive map - compare trends geographically
If you’re interested in comparing geographies in Illinois (neighborhood to neighborhood, city to county, etc), take a look at our interactive map. It holds data from the county level down to individual Census tracts, and is built on TileMill/MapBox.
If you’re preparing for a meeting with your legislator, you can overlay legislative boundaries to demonstrate how a particular district is doing relative to others. Like the data portal, it contains information on foreclosures, mortgages, housing, income, and employment.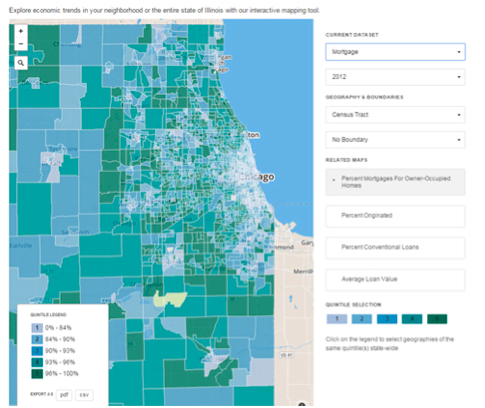
- Data compendium - download raw data
Don’t care about pretty maps and visualizations? Just want to get your hands on the raw data? Check out Woodstock Institute’s data compendium, a portal powered by CKAN.
The compendium holds the source datasets behind our portal and map, as well as many others - datasets about zombie properties, retirement savings, complaints about financial institutions, and more. Here, you can find the HMDA dataset, mentioned earlier, which has information on whether mortgages were originated, denied, or withdrawn, as well as key information about the borrower and the home.
The datasets are prepared by Woodstock Institute and the former Metro Chicago Information Center (MCIC), a nonprofit active in the Chicago region from 1990-2011 that compiled historical community-level data.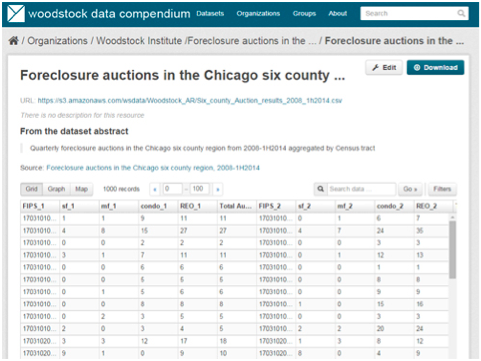
Now it’s your turn
We know that we don’t have the capacity to investigate all of interesting questions in these datasets, so we hope that releasing our data will inspire people to conduct their own research on the economic well-being of Illinois neighborhoods.
For example, HDMA raises many questions that haven’t yet been researched, such as:
- Do mortgage denial rates correlate with other measures of economic activity, such as number of grocery stores, small businesses, or TIF investments?
- Do mortgage denial rates correlate with property values?
- Has the median age of mortgage borrowers changed over time as young adults are burdened with more and more student debt that may cause them to delay home purchases?
So, check out our data resources, and share your analyses with us! We can’t wait to see what you do with the data.
About the author

Katie Buitrago
Katie Buitrago presented at Open Gov Hack Night on Jan 6th, 2015 with her colleague Julianna Nunez. She is the Senior Policy and Communications Associate at Woodstock Institute and a student at the Harris School of Public Policy at the University of Chicago. Katie researches and advocates to limit the negative impacts of harmful student debt, predatory payday loans, the fallout from the foreclosure crisis, and more. Thanks to grad school, she has a newfound love for Stata. You can follow her on Twitter @katiebuitrago.